
Profiling Neovim on big logs: a growing 87 MB log froze the UI 11 s out of every 15
 william 收录于 Tools
After the startup pass,
the slowest thing left in my Neovim was big log files. ~/log holds logs from
0.5 MB to 136 MB. The one I read most is 87 MB: 176,939 lines of about 500
characters, growing by about 2 lines a second while I read it. Opening it took
1.9 s before Neovim accepted a key. n, /, typing and <Esc> each stalled.
Just reading the log while it grew froze the UI for about 11 of every 15
seconds.
No single plugin was to blame. Several separate pieces of work grew with the
file, and one key mapping slowed n in every file. Medians of 5 runs in a
real terminal:
| before | after | |
|---|---|---|
| open the 87 MB log until keys are accepted | 1857 ms | 199 ms |
n |
523 ms | 21 ms |
| UI blocked per 15 s while reading the growing log | 10963 ms | 0 ms |
The setup
- Neovim v0.12.5, LuaJIT 2.1, LazyVim on lazy.nvim, the same config as in the startup post.
- The main test file is that 87 MB log: 176,939 lines, 486 characters per line
on average. 176,868 of the lines contain tmux color codes like
#[fg=...], so they are full of brackets. - snacks.nvim’s
bigfilemodule was already on, with a 1.5 MB threshold. Above it, snacks setsfiletype=bigfile, and mysetuphook turns off folds, the status column, completion and mini.animate. - Every change below applies only to buffers over 1.5 MB, except one key mapping that affected every file.
Step 1: measure in a real terminal
In the startup post, headless timing turned out to be too optimistic. Here it would have missed most of the problem. The costs were in redraws and in work done on each key after the file was open. So I built a harness that runs Neovim in a real terminal and times keys the way I feel them:
- Neovim runs inside a private tmux server (
tmux -L nvbench -f /dev/null, 200×50), started with--listenon a socket. - A Python script attaches with pynvim and
sends each key with
nvim_input. Right after it, the script sends a trivial request,eval("0"). Neovim only answers once it has processed the key and redrawn, so the round trip is the latency of that key. The time the terminal takes to render isn’t included.
bench.py:
|
|
The rest of the method:
- Stalls not tied to a key. The same
eval("0")ping runs every 5 ms. A slow answer means Neovim was busy, and pings slower than 20 ms are added up as “blocked” time. “Open until stalls stop” is the last ping slower than 50 ms in the 4 s after opening. - One editing session per run:
G,gg,<C-d>,j,k,<C-f>,o, typing a line,<Esc>,u,dd,p,w,/ERROR<CR>,n. - The growing log. A thread appends a copy of the file’s last line every
0.5 s. One scenario reads with a
jevery second for 15 s. The other runs:Tailfor 12 s. - Before and after are two copies of the config. Each has its own
XDG_CONFIG_HOME,XDG_STATE_HOMEandXDG_CACHE_HOME, and swap and undo directories are cleared before every run. Each side gets one warm-up and 5 measured runs, alternating which side goes first. I report medians with min–max, plus 3 runs ofnvim --cleanas a floor. Load average was 2.5–3 on 20 cores. - Every run checks that the keys did their work.
Greached the last line,ggline 1,kmoved up, the typed text landed, and<Esc>got back to normal mode. New lines arrived in the growing log, and:Tailkept the cursor on the last line. A fast key that did nothing proves nothing.
One practical snag: a Unix socket path is limited to 108 bytes, and my scratch directory’s path was longer than that. tmux starts Neovim in that directory, so a relative path works:
|
|
Finding the hot spots
The harness shows which key is slow, not why. I used two tools for the why:
-
Native code.
perfisn’t installed on this machine, so I sampled stacks with gdb in a loop while a stall was going on. Each call stops the process briefly and prints one stack. A dozen samples during a long stall make a crude profiler, but it was enough.1gdb -p <nvim-pid> -batch -ex 'bt 25' -
Lua. A small
prof.lua, loaded with--cmd "luafile prof.lua", wraps every autocmd callback,vim.schedule,vim.defer_fn, libuv timer andnvim_buf_attachcallback, and adds up the time per source location. LuaJIT’s sampling profiler (jit.p) covered the rest.
Step 2: what grew with the file
undofile hashed 87 MB on every read
I keep undofile on. :help undo-persistence explains what that costs when
a file is read:
Vim will detect if an undo file is no longer synchronized with the file it was written for (with a hash of the file contents) and ignore it when the file was changed after the undo file was written
So after every read Neovim computes a SHA-256 of the whole buffer. On an
autoread reload it hashes the buffer twice and rewrites the undo file. That is
where the gdb samples landed during a reload stall. Measured with
nvim --clean on the 87 MB log, turning undofile off took open from 245 to
42 ms and a reload from 552 to 134 ms.
The option has to be off before the read. snacks’ bigfile setup runs after
the file is loaded, which is too late. So the snacks spec now registers a
BufReadPre hook in its init:
lua/plugins/snacks.lua:
|
|
The hook does two more things, covered in the next two sections.
The size check has to come before the filetype
b:bigfile exists because filetype=bigfile arrives too late for some
plugins. baleia, which colorizes ANSI codes in logs
(setup here), loads on
BufReadPost *.log and colorizes the buffer right away. On the first load the
filetype isn’t bigfile yet, so a filetype check missed it. A flag set in
BufReadPre from the file size exists before any of that runs:
lua/plugins/baleia.lua:
|
|
once() scanned every line for ANSI codes, on open and again on every
reload. These logs don’t contain any, since the tmux codes are plain text.
:BaleiaColorize still works on demand.
The treesitter foldexpr ran for every line during the read
post.lua sets foldmethod=expr with vim.treesitter.foldexpr() globally.
While the file was read, the expression was evaluated for each line: 182 ms,
against 44 ms with manual folds. The hook sets window-local foldmethod=manual, but only when
the buffer being read is in the current window, because the option belongs to
the window.
n waited 500 ms, in every file
This one had nothing to do with size. n took 523 ms in the 87 MB log, but
also 532 ms in an 812 KB log and 504 ms in a 110 KB Python file. My
timeoutlen is 500. When a key costs exactly timeoutlen, Neovim is waiting
to see whether the key starts a longer mapping. Here the mapping was a
virt-column toggle:
lua/plugins/virt-column.lua:
|
|
With nc mapped, every n waited timeoutlen for a possible c.
<nowait> doesn’t fix it cleanly. A quick test with nvim --clean showed
that a <nowait> n stops the wait only by making nc unreachable. So the
toggle moved to <leader>uv. Afterwards n took 21 ms in the 87 MB log (the
same as nvim --clean, so that’s Neovim’s own search), 6 ms in the 812 KB log
and 1.4 ms in the Python file.
Plugins doing per-key work in big buffers
The rest were plugins doing work proportional to the file size or the line length, on every key, jump or reload:
| plugin | what it did | cost in the 87 MB log | fix |
|---|---|---|---|
| flash.nvim | search labels: an unbounded searchpos() per typed character |
/ERROR from the top: 1.3 s |
labels off during / and ? |
| hiPairs | synstack() per bracket. The log syntax’s .*\<ERROR\>.* patterns re-scan 500-character lines from every column |
/ERROR: 374 ms |
b:pair_list = {} |
| ultimate-autopair | scans the 1000 lines around the cursor for pairs on each key | ~200 ms per typed space | bigfile in the filetype nft list |
| smear-cursor.nvim | scroll_buffer_space measures the wrapped height of every line a jump scrolls past |
820 ms per G/gg |
filetypes_disabled = { "bigfile" } |
| nvim-ufo | bigfile fell through to the comment-fold provider, which copies every line into Lua on each fold update |
790 ms stall after an edit | bigfile = '' |
Most of the fixes are one line each:
|
|
flash needs more than one line. Its search labels should stay on in normal
files, so a CmdlineEnter hook turns them off only while a / or ? search
runs in a big buffer, and a CmdlineLeave hook restores them. It’s registered
in init so that it runs before flash’s own CmdlineEnter handler:
lua/plugins/flash.lua:
|
|
A few details that matter:
-
hiPairs skips buffers without pairs, so an empty
b:pair_listturns it off for that buffer only. -
ultimate-autopair’s
nftreplaces the default list.TelescopePromptis the default, so it has to stay in the list. -
The smear cost doesn’t show in the harness’s
G/ggrow (30/33 ms before). smear does its work in a timer callback after the jump (smear_cursor/events.lua). By then Neovim has already answered the harness’s ping. The callback profile caught it:13329.0 ms n=7 max= 838.0 schedule_wrap smear-cursor.nvim/lua/smear_cursor/events.lua:55 -
I found autopair late. My first full after-run still had a typing p95 of 251 ms, and that turned out to be ultimate-autopair. I re-ran the 87 MB scenario after fixing it, and the tables below use that re-run.
Step 3: follow a growing log without re-reading it
Two things re-read the whole 87 MB while the log grew:
- An idle check in
options.luaranchecktimeonBufEnter,CursorHoldandCursorHoldI. Withupdatetime=250, every pause of a quarter second or more after the file had grown triggered a full reload. Even after theundofilefix, each one blocked for 130 ms or more. - My
:Tailcommand follows new lines liketail -f. It polls the file once a second and ranchecktimeon every change. When I wrote it two days earlier, I marked that as a shortcut: re-read the whole buffer on every change, and read only the appended bytes if huge logs ever stutter. They did.
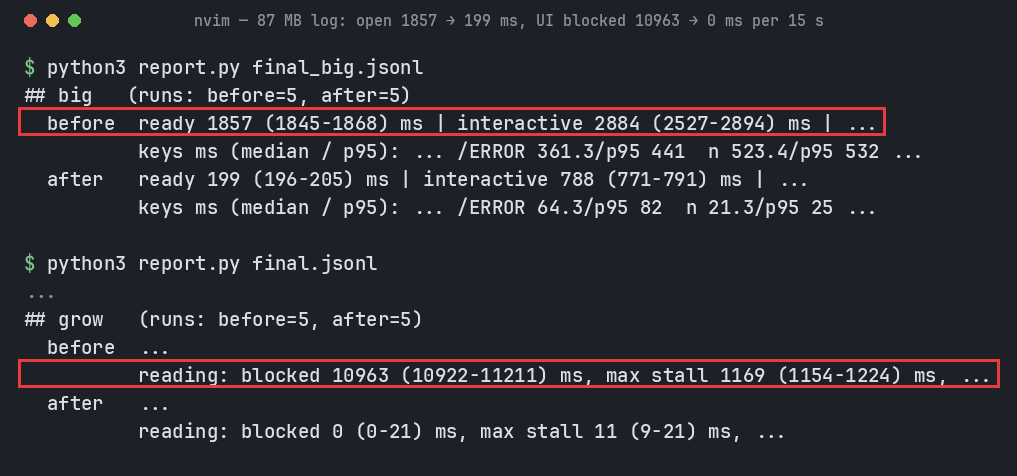
Before the fix, reading the growing log blocked the UI for 10963 ms out of
15 s, and :Tail blocked it for 17230 ms in a 12 s window. The total is
longer than the window because the probe waits for its last ping to come back
after the window ends. In practice Neovim was barely responsive.
Big buffers now skip the plain idle checktime:
lua/options.lua:
|
|
A new autocmd on the same events, and :Tail, call refresh_appended(buf)
in commands.lua instead. It reads only the new bytes, and only when it can
prove the file just grew. Otherwise it falls back to a full checktime:
- buffer modified: plain
checktime, which shows the usual W12 warning - not
fileformat=unix, has a BOM, or not utf-8: full reload - different inode (log rotated or replaced): full reload
- file shorter than what the buffer holds: full reload
- same size but a different mtime (rewritten in place, or touched): full reload
- same size, same mtime: nothing to do, one
statand no file read
If the file grew, the function first re-reads the bytes just before the old end and compares them with the buffer’s last line. Then it reads the new bytes. Comments are translated from the Chinese originals:
lua/commands.lua:
|
|
A few details that matter:
- A partial last line is completed in place. A writer can flush half a
line and finish it later. Without a trailing newline the buffer has
noeol, and the next append is joined onto that last line. - Appended lines are not undo steps. Otherwise
uwould delete log lines and mark the buffer modified, and from then on every refresh would take the modified-buffer path and warn. The cost is that an append clears the buffer’s in-memory undo history. tail_seenstores the inode and mtime from the last full read or append. That is how a same-size rewrite is told apart from “nothing happened”.
tests/performance_tail.lua covers complete and partial appends, no growth,
shrinking, rewrites, modified buffers, small files and :Tail. The
partial-line part:
|
|
|
|
|
|
The W12 comes from the modified-buffer case, which is expected to warn. I also checked a copy of the 87 MB log headless. After appends that included a partial line, its completion and a Chinese line, the buffer’s SHA-256 matched the file’s. A refresh with no growth costs 0.06 ms, and an append 0.3–0.4 ms.
Results
The raw numbers come from the harness’s summary script:
|
|
|
|
|
|
|
|
The 87 MB log (176,939 lines), medians with min–max for the open times:
| before | after | nvim --clean |
|
|---|---|---|---|
| open until input is accepted | 1857 ms (1845–1868) | 199 ms (196–205) | 89 ms |
| open until stalls stop | 2884 ms (2527–2894) | 788 ms (771–791) | 89 ms |
n |
523 ms | 21 ms | 21 ms |
/ERROR<CR> |
361 ms | 64 ms | 22 ms |
G / gg (without smear’s deferred work) |
30 / 33 ms | 9 / 10 ms | 1 / 2 ms |
| typing, p95 per key | 175 ms | 5 ms | 2 ms |
<Esc> after typing |
272 ms | 28 ms | 1 ms |
| longest stall in the 2 s after editing | 792 ms | 23 ms | 2 ms |
The 1.3 s in the flash row was a /ERROR from the top of the file. Here the
search runs partway through the editing session, so the two numbers aren’t
comparable.
The same log while another process appends a line every 0.5 s:
| before | after | |
|---|---|---|
reading with a j each second: UI blocked per 15 s |
10963 ms (10922–11211) | 0 ms (0–21) |
| reading: longest stall | 1169 ms | 11 ms |
:Tail: UI blocked per 12 s |
17230 ms (17189–17493) | 0 ms (0–41) |
:Tail: longest stall |
6238 ms | 10 ms |
New lines reached the buffer in every run, and :Tail kept the cursor on the
last line in 5 of 5 runs.
For files under 1.5 MB (an 812 KB log and a 110 KB Python file), only n
changed: 532 → 6 ms and 504 → 1.4 ms. Every other key and the open time
showed no measurable difference.
Later the same day: an org archive in every startup
Even after these fixes, the 87 MB log took 788 ms until the stalls stopped. About 590 ms of that had nothing to do with size. Small files paid the same: 716 ms for the 812 KB log and 899 ms for the Python file. The biggest piece was orgmode. About 1 s after startup, its reminders parse every agenda file.
My agenda glob was ~/orgfiles/**/*, and that includes archive/. orgmode
only recognizes *.org_archive files as archives, and
I had renamed mine to .x.org.
So a 520 KB archive file was parsed as an ordinary agenda file at every start:
305 ms with it, 41 ms without it (headless, 3 runs each). archive/ held 506
of my 619 headlines.
The agenda now lists the top-level files plus every subdirectory except
archive/:
lua/plugins/orgmode.lua:
|
|
Loading the agenda files and starting the reminders went from 415 ms
(411–431) to 82 ms (80–89). I measured that with each config’s own agenda
setting, in 6 alternating fresh headless runs per side. The load average was
about 5, against 2.5–3 earlier, which is likely why both numbers are higher
than the first 305/41 ms. The files loaded went from 13 to 10. A
check against the real ~/orgfiles found that the new list equals the old
glob minus archive/. Archiving still writes to archive/<name>.x.org. Unlike the
big-file changes, this one speeds up every start.
What I lose: agenda views, agenda search, tag completion and refile targets no longer include archived entries. The subdirectory list is built when orgmode loads, so a new subdirectory joins the agenda after a restart.
A fake $HOME isn’t isolation
I tested archiving with a throwaway $HOME, so that my real org files were
safe, while the config was still read from its real location. That mix is
not safe for lazy.nvim. My lazy.nvim root is built from $HOME:
|
|
The lockfile, though, defaults to the config directory. lazy.nvim found no
plugins under the fake home, cloned them there, and rewrote my real
lazy-lock.json: 13 entries were gone and two commits had changed. The
freshly cloned nvim-treesitter also repointed three query links (ecma,
html_tags, jsx) in my real ~/.local/share/nvim/site/queries at the fake
home, because XDG_DATA_HOME still pointed at the real data directory. I
restored the lockfile from a copy taken earlier, byte for byte, and pointed the
links back. The safe way is to symlink $HOME/.config/nvim in the fake home to
the real config, so lazy.nvim finds every plugin installed and has nothing to
clone, and to checksum the lockfile and site/ before and after the test.
What big files lose, and what’s left
Buffers over 1.5 MB no longer get persistent undo, ufo folds, autopairs, the
smear animation, baleia colors, hiPairs or flash search labels. Appended lines
aren’t undo steps, and an append clears the buffer’s in-memory undo history.
:BaleiaColorize still colors a big log on demand.
Still open:
FocusGainedstill runs a plainchecktimeover all buffers. After incremental appends, Neovim’s stored timestamp for the file is stale, so the first focus change does one full reload of a growing big log (about 130 ms).- smear-cursor’s jump cost still grows with distance in files under 1.5 MB:
G/ggtake about 20 ms in the 7,600-line log. Turning offscroll_buffer_spacewould remove that, but it changes the animation.
Takeaways
- A per-key cost equal to
timeoutlenmeans a pending mapping. Look for mappings that start with that key (:nmap n). A two-letter mapping that starts withntaxes everyn. - Measure in a real terminal, and know what the harness misses. The tmux + pynvim harness caught the redraw and per-key costs that headless timing misses. But smear’s stall ran after the harness had its answer, and only the callback profile showed it.
- Decide “big” before the read.
filetype=bigfilecomes too late forundofile, forfoldexprduring the read, and for plugins that act onBufReadPost. ABufReadPresize check runs before all of them. undofilecosts a full-buffer hash on every read and reload. For the 87 MB log that was about 200 ms per open and over 400 ms per reload.- Don’t re-read a file that only grew, but prove that it only grew. Check the inode, size and mtime, and compare the bytes at the old end. Anything else falls back to a full reload. It’s better to be slow than to show the wrong content.
- Check that the keys did their work, and that every test can fail. The
harness checks the cursor and the buffer in every run.
tests/performance_plugins.luaasserts each per-size change, and removing any one of the fixes makes it fail with its own message.
References
相关内容
- Profiling Neovim startup: lazy-loaded plugins that weren't lazy
- Profiling zsh: a Python plugin was adding 190 ms to every command
- Why my tmux was laggy: the status bar was forking a 1.2 GB server 24 times a second
- nvim dap 映射 r 快捷键
- tmux lag, round 2: every status-bar fork froze the server for 30 ms
 支付宝
 微信