
Profiling zsh: a Python plugin was adding 190 ms to every command
 william 收录于 Linux
After fixing tmux, I looked at the shell running inside it. My zsh config had grown over a few years to about 30 plugins and Oh My Zsh snippets on top of zinit and Powerlevel10k. It felt a little heavy, but nothing stood out.
Measured properly, it was slow in three separate ways, each with its own cause:
| before | after | |
|---|---|---|
| startup to a usable shell | 267 ms | 101 ms |
| added to every command | 188 ms | 3 ms |
| added to every prompt | 15 ms | 4 ms |
This post covers how I measured each one, the fixes, and how I checked that the fixes didn’t change anything else. That check caught two mistakes of my own.
The setup
- zsh 5.8 on Linux Mint 20.3
- zinit, with many plugins in
turbo mode (
wait), which loads them just after the first prompt - Powerlevel10k with instant prompt
- zsh-vi-mode, fzf-tab, zsh-autosuggestions, fast-syntax-highlighting, and three directory jumpers (zoxide, autojump, zsh-z)
Startup: the easy number is misleading
The usual first measurement:
|
|
That gave a median of 148 ms, against 2 ms for zsh -f. Not great, but
not alarming either. It turned out to be the optimistic number, for two
reasons:
zsh -i -c exitexits before zinit’s turbo plugins load, so it never sees them. They still cost time in a real shell: right after the prompt appears, anything you type waits until they’ve finished.- Running it back to back leaves a cache in a state that real use never does. More on that under compinit below.
Powerlevel10k’s instant prompt hides startup time too. It draws the prompt
before .zshrc has finished, but your keystrokes aren’t handled until the
config is done.
Profile every line with xtrace timestamps
zsh can timestamp every traced line. %D{%s.%6.} in PS4 gives microseconds:
|
|
Each trace line shows the file (or function) and line number. To charge
everything to a top-level line of .zshrc, add up the time from each .zshrc
line to the next one, which includes everything that line sourced or called:
|
|
Tracing roughly doubles the run time (275 ms traced), so read the ranking rather than the absolute numbers. The top of the list was mostly duplication:
ssh-agentloaded twice, asOMZ::plugins/ssh-agent/...and asOMZP::ssh-agent, which is the same file. Each load checked the agent and its keys again.- fzf set up twice. The Oh My Zsh fzf plugin runs
eval "$(fzf --zsh)"itself, and my config ran it again a few lines later. OMZ::lib/history.zshloaded twice, once synchronously and once in turbo mode.- A tmux plugin loaded into zsh.
zinit light tmux-plugins/vim-tmux-focus-eventsloads nothing useful into zsh: it’s a Vim/tmux plugin. The line after it,set -g focus-events on, is tmux syntax. In zsh,set -gturns on an option (-gisHIST_IGNORE_SPACE), and the remaining words become the shell’s arguments. My interactive shell had been running with$1=focus-eventsand$2=onfor who knows how long.
All of that was real but small: a few milliseconds per item. The large costs were elsewhere.
Measure the shell you actually use
To see turbo plugins and hooks, you need an interactive shell with a terminal.
Python’s pty module provides one:
|
|
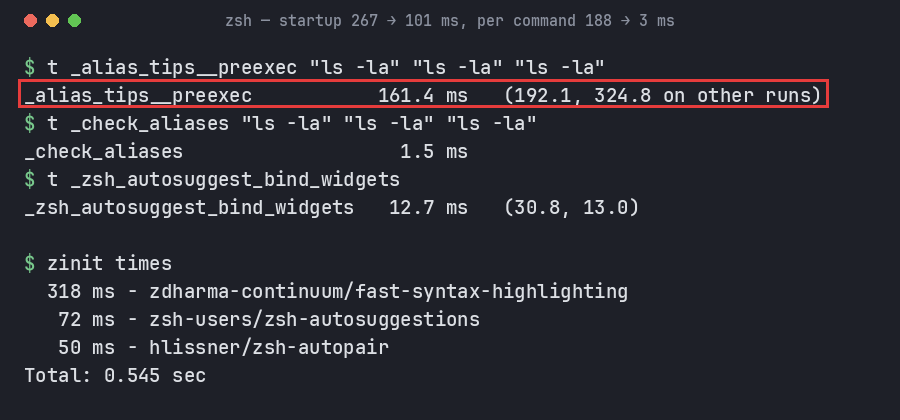
zinit times lists how long each plugin took to load. Three turbo plugins
stood out:
|
|
fast-syntax-highlighting isn’t slow by itself. Its atinit runs compinit,
the completion system setup, and that’s where the 318 ms went.
The same shell can also show which functions run before every command
(preexec) and before every prompt (precmd), and time them:
|
|
|
|
Every command: alias-tips ran Python
alias-tips reminds you when you type a
command that has an alias. Before every command, its preexec hook:
- runs
git config --get-regexp '^alias\.'through fourseds, - dumps the full source of every function in the shell through
grep(my shell has 2,552 functions), - pipes all of that into
python3 alias-tips.py.
The first python3 on my PATH is miniconda’s, which is slow to start. Together
that’s 160–325 ms of waiting after every Enter, before the command even
starts. It’s easy to blame the command itself for that delay.
I already had zsh-you-should-use, which gives the same reminders in pure zsh in 1.5–4 ms. So alias-tips went.
Every prompt: settings that never took effect
zsh-autosuggestions has to wrap zle widgets to work. By default it re-wraps
all of them before every prompt, in case another plugin has replaced one. I
have 854 widgets, so that took 13–31 ms on every prompt. Setting
ZSH_AUTOSUGGEST_MANUAL_REBIND turns this off, and my config did set it:
|
|
Look at the backslashes. Inside a double-quoted string, backslash-newline is a
line continuation, so the atload code is a single line:
|
|
Written like that, the three assignments are prefix assignments to
bindkey: they only exist while bindkey runs. Only the key binding ever
took effect. In the running shell, the strategy was still the default
(history) and MANUAL_REBIND was unset. Note too that the plugin only checks
whether MANUAL_REBIND is set: 0 would have enabled it as well.
The fix sets the variable as a real assignment, before the plugin reads it:
|
|
I left STRATEGY and HISTORY_IGNORE out on purpose. They had never worked,
so turning them on now would change how suggestions behave, and the completion
strategy costs time on every keystroke. That’s a separate decision.
Rebinding once is safe here because every plugin that wraps widgets loads before autosuggestions.
Every start: two compinits fighting over one cache
Why did compinit take 318 ms? The startup trace had a clue: compinit also
showed up before .zshrc was read. Ubuntu’s /etc/zsh/zshrc runs its own:
|
|
On Mint, that pattern matches the ID_LIKE=ubuntu line, so it runs here too.
That gives two compinits per shell. The global one runs with only the system
completion directories, and zinit’s runs later with all 36 (fpath). Both use
~/.zcompdump. compinit only reuses that cache if it was built for the same
set of files (its first line records the count), so each run found the other’s
cache stale and rebuilt it. Its timestamp changed with every new shell:
|
|
This is also why the 148 ms startup number was optimistic. Back-to-back
zsh -i -c exit runs never reach zinit’s compinit, so the cache stayed valid
for the global one. In real use, every interactive shell leaves a cache built
for the full fpath. When I restored that state before each run, startup was
267 ms.
The fix is a single line in ~/.zshenv:
|
|
…which exposed lost completions
Plugins call compdef to register completions as they load. Before compinit
has run, compdef doesn’t exist yet, so zinit records those calls in a queue
for zinit cdreplay to apply later. My config never called cdreplay. The
queue held 21 entries that had never been applied:
|
|
With complete_aliases off, tmux <Tab> completes for whatever the alias
expands to, and _zsh_tmux_plugin_run had no completion registered. So it had
been offering file names instead of tmux commands. Running the replay right
after compinit fixed it:
|
|
Proving nothing else changed
Deleting duplicate plugins sounds harmless, but the order in which plugins load matters. Before touching anything, I dumped everything that defines how the interactive shell behaves, inside a real interactive shell after the turbo plugins had loaded:
|
|
(The real version also skips parameters that change on their own, such as
RANDOM, PPID and Powerlevel10k’s internal state.)
I took one snapshot before and one after, and diffed them by section. The diff caught two regressions I had introduced:
-
cdlost zoxide’s completion. zoxide only registers it ifcompdefalready exists whenzoxide initruns. With the global compinit gone, it doesn’t. The fix queues it for the replay instead:1(( ${+functions[compdef]} )) || zicompdef __zoxide_z_complete cd -
Tab quietly changed. fzf-tab wraps whatever Tab is bound to at the moment it loads. The Oh My Zsh fzf plugin I deleted had bound fzf’s completion widget to Tab earlier in the file, so the old chain was fzf-tab → fzf-completion (fzf’s
**<Tab>trigger) → normal completion. Without it, fzf-tab wrapped normal completion directly, so fzf’s**<Tab>trigger was out of the chain. Running fzf’s own setup before fzf-tab restores it:1 2 3eval "$(fzf --zsh)" zinit light Aloxaf/fzf-tab bindkey -M emacs '^I' fzf-completion # what the old second `fzf --zsh` left there
After those fixes, key bindings, aliases, all 854 widgets, options, zstyles,
fpath and PATH were identical. The only differences left were the intended
ones: the removed plugin, the two hooks I took out, the replayed completions,
and two new settings. There was also one side effect I accepted: psql and the
other PostgreSQL tools now complete with zsh-completions’ _pgsql_utils
instead of zsh’s own _postgresql. Both packages provide completion for those
commands, and with only one compinit, zsh-completions’ version wins.
Results
Old and new configs measured the same way (the old one via ZDOTDIR, with its
completion cache restored to its real-life state before each run):
| before | after | |
|---|---|---|
startup, zsh -i -c exit, median of 15 |
267 ms | 101 ms |
preexec hooks, i.e. added to every command |
188 ms | 2.9 ms |
precmd hooks, i.e. added to every prompt |
14.9 ms | 3.9 ms |
all plugin loading (zinit times total) |
0.39–0.42 s | 0.13 s |
What I left alone
- Caching
eval "$(tool init)"output. This is a common tip, butfzf --zshtook 1.3 ms andzoxide init0.4 ms. Not worth the cache invalidation. - Compiling
~/.p10k.zsh. It took 2.7 ms to source, or 0.8 ms compiled. Also not worth the extra moving part. - The three directory jumpers. Counting my last 20,000 commands: zoxide’s
cd2,187, autojump’sj225, zsh-z’sz16. I use all three. - The ssh-agent zstyles (
lazy,quiet,identities). They come after the plugin in my config, so they have never applied. Moving them up would change when keys get added, so I left them and added a note.
Traps
- Test shells write to your real history. With
share_historyandinc_append_history, every command typed into a throwaway shell goes straight to~/.zsh_history. Start each one with a space:hist_ignore_spacekeeps it out. grepthinks zsh history is binary. zsh stores non-ASCII text in its own “metafied” form. Without-a,grep -cquietly counted zero for every command I looked for.zsh -i -c exitonly measures part of the startup. It misses turbo plugins, every hook, and, here, the cache rebuilds.- Backslashes inside quoted plugin settings. If a zinit
atloadoratinitstring spans several lines, check what it looks like as one line.
Takeaways
- Measure all three latencies: startup, per prompt and per command. The biggest cost here was per command, and no startup benchmark would ever show it.
- List your hooks.
print -l $preexec_functions $precmd_functionsshows everything that runs every time you press Enter. Time each one. - Watch for two compinits. On Ubuntu and its derivatives,
/etc/zsh/zshrcruns one unlessskip_global_compinit=1is set. If your plugin manager runs another, they fight over the cache. - If compinit runs late, replay the queued compdefs. Otherwise completions disappear without any error.
- Diff the shell’s state before and after. Load order matters, and I’d
have shipped a broken
cdcompletion and Tab chain without the snapshot.
References
- zsh-bench: a proper tool for measuring first-prompt, command and input lag
- zinit: turbo mode,
zicompinitandzicdreplay - zsh-autosuggestions:
ZSH_AUTOSUGGEST_MANUAL_REBIND - fzf-tab
- zsh manual: prompt expansion (
%D{...},%N,%i) forPS4 - The tmux half of this cleanup
相关内容
- Why my tmux was laggy: the status bar was forking a 1.2 GB server 24 times a second
- zsh compinit: insecure directories, run compaudit for list
- tmux lag, round 2: every status-bar fork froze the server for 30 ms
- (转)Linux 网络大流量传输优化方法
- tmux 设置默认 zsh
 支付宝
 微信