RShiny 使用指南

警告
本文最后更新于 2021-07-10,文中内容可能已过时。

RShiny 是什么

Shiny 是一个 R 语言的软件包,提供了用于制作 Web-UI/app 的便捷工具。这些应用提供了交互式的数据展示、实时的统计分析与高度可定制化的操作界面,并且可以以网站或者独立的应用分享和发布。通过 RShiny,我们可以非常方便的与他人分享自己的数据研究成果,随时监控关心的信号指标。

可以访问 RShiny 的官网查看案例集,你会发现原来可以通过在 R 中调用简单的几个命令,就可以制作出如此精妙的 Web-UI,而不用再纠结与 HTML-CSS-Javascript 的细枝末节里。实在是「居家旅行、获奖无数」的必备良品。

是不是很期待?来吧,接下来请接受代码的暴风雨。。。。。。

怎么使用

安装

由于 Shiny 会开启 systemd 网站服务,因此安装 Shiny 需要管理员 root 权限。

当然,我们也可以在 Docker 中安装,然后把相关的 3838 端口转发出来,一样可以在外部访问该服务。

安装 shiny 包

1
2
## 1. Shiny 包安装,一定要使用 root 权限,才可以添加服务项
$ sudo su -c "R -e \"install.packages('shiny', repos='https://cran.rstudio.com/', dep=TRUE)\""

安装 gdebi

1
2
3
4
## 2. 安装 gdebi(用于安装 Shiny Server 及其所有依赖项)和 Shiny Server
$ sudo apt-get install gdebi-core
$ wget https://download3.rstudio.org/ubuntu-14.04/x86_64/shiny-server-1.5.14.948-amd64.deb
$ sudo gdebi shiny-server-1.5.14.948-amd64.deb

开启 shiny-server 服务

 1
 2
 3
 4
 5
 6
 7
 8
 9
10
11
12
13
14
15
## 3. shiny-server 命令
#启动
$ sudo systemctl start shiny-server
#停止
$ sudo systemctl stop shiny-server
#重启
$ sudo systemctl restart shiny-server
#查看状态
$ sudo systemctl status shiny-server
#服务器重新初始化,但不会中断服务器当前进程或任何连接。

$ sudo systemctl kill -s HUP --kill-who=main shiny-server
$ sudo reload shiny-server
#shiny-server状态
$ sudo systemctl status shiny-server

查看安装

1
2
## 4. 查看 shiny-server: http://localhost:3838/
## 查看 demo: http://localhost:3838/sample-apps/hello/

配置

 1
 2
 3
 4
 5
 6
 7
 8
 9
10
11
12
13
14
15
16
17
18
19
20
21
22
23
24
25
26
## 5. 配置
/etc/shiny-server/shiny-server.conf
/opt/shiny-server/config/default.config

# Instruct Shiny Server to run applications as the user "shiny"
run_as shiny;

# Define a server that listens on port 3838
server {
  #listen 3838;
  listen 3838 0.0.0.0;

  # Define a location at the base URL
  location / {

    # Host the directory of Shiny Apps stored in this directory
    site_dir /srv/shiny-server;

    # Log all Shiny output to files in this directory
    log_dir /var/log/shiny-server;

    # When a user visits the base URL rather than a particular application,
    # an index of the applications available in this directory will be shown.
    directory_index on;
  }
}

添加用户

1
2
3
4
5
6
7
8
9
## 6. 创建用户
## sudo /opt/shiny-server/bin/sspasswd /etc/shiny-server/passwd admin

## 7. Rmarkdown
$ sudo su - -c "R -e \"install.packages('rmarkdown',repos='http://mirror.bjtu.edu.cn/cran/')\""

## 8. 所有的 app 都放在 /srv/shiny-server

## 9. 外部可以访问 192.168.1.88:3838

Demo

 1
 2
 3
 4
 5
 6
 7
 8
 9
10
11
12
13
14
15
16
17
18
19
20
21
22
23
24
25
26
library(shiny)
library(ggplot2)
library(ggthemes)
library(plotly)

ui <- fluidPage(
    titlePanel("Plotly"),
    sidebarLayout(
        sidebarPanel(),
        mainPanel(
            plotlyOutput("plot2"))))

server <- function(input, output) {

    output$plot2 <- renderPlotly({
        print(
            ggplotly(
                ggplot(data = mtcars, aes(x = disp, y = cyl)) +
                    geom_smooth(method = lm, formula = y~x) + geom_point() + theme_gdocs()
            )
        )

    })
}

shinyApp(ui, server)

技术细节

为了搭建 Shiny 服务,我们首先需要制作一个快加,把需要的元素放在这里

 1
 2
 3
 4
 5
 6
 7
 8
 9
10
11
12
13
14
library(shiny)

# Define UI ----
ui <- fluidPage(

)

# Define server logic ----
server <- function(input, output) {

}

# Run the app ----
shinyApp(ui = ui, server = server)

ui 前端

1
2
3
4
5
6
7
8
9
ui <- fluidPage(
  titlePanel("title panel"),

  sidebarLayout(
    position = "right",
    sidebarPanel("sidebar panel"),
    mainPanel("main panel")
  )
)

titlePanel and sidebarLayout are the two most popular elements to add to fluidPage. They create a basic Shiny app with a sidebar.

sidebarLayout always takes two arguments:

  • sidebarPanel function output
  • mainPanel function output

The sidebar panel will appear on the left side of your app by default. You can move it to the right side by giving sidebarLayout the optional argument position = "right".

布局可以参考:Application layout guide

shiny function HTML5 equivalent creates
p <p> A paragraph of text
h1 <h1> A first level header
h2 <h2> A second level header
h3 <h3> A third level header
h4 <h4> A fourth level header
h5 <h5> A fifth level header
h6 <h6> A sixth level header
a <a> A hyper link
br <br> A line break (e.g. a blank line)
div <div> A division of text with a uniform style
span <span> An in-line division of text with a uniform style
pre <pre> Text ‘as is’ in a fixed width font
code <code> A formatted block of code
img <img> An image
strong <strong> Bold text
em <em> Italicized text
HTML Directly passes a character string as HTML code

输入

https://shiny.rstudio.com/tutorial/written-tutorial/lesson3/images/basic-widgets.png

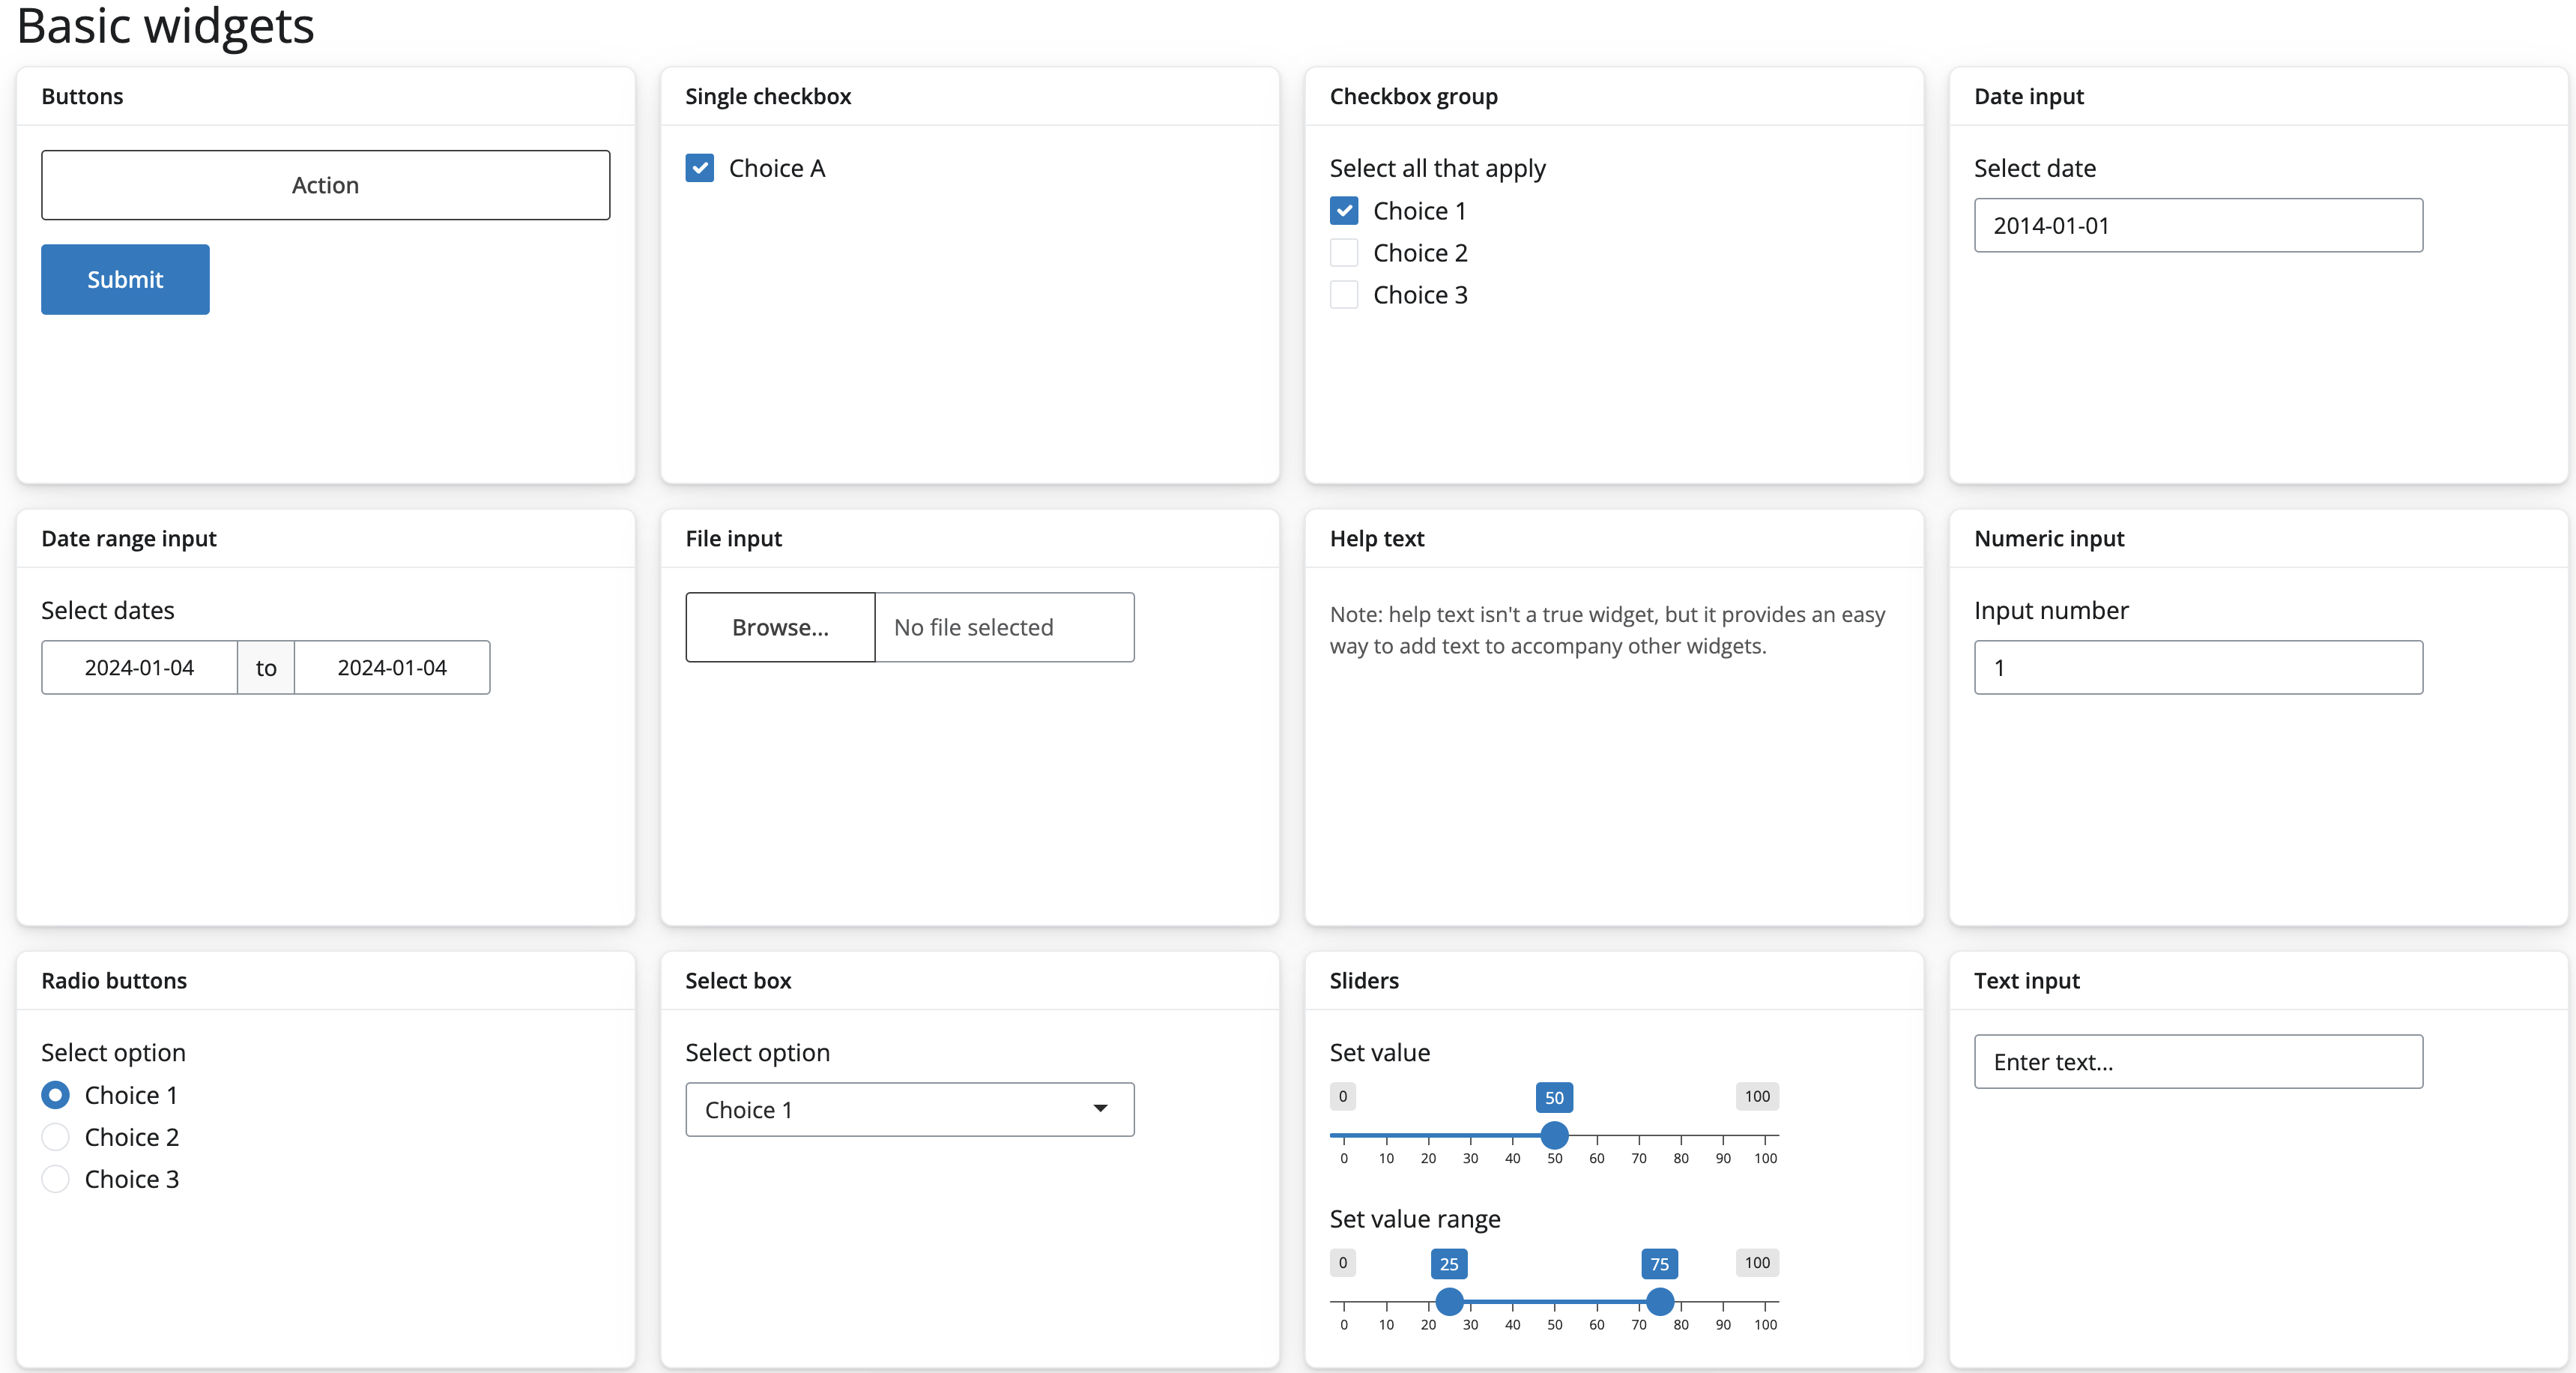
The standard Shiny widgets are:

function widget
actionButton Action Button
checkboxGroupInput A group of check boxes
checkboxInput A single check box
dateInput A calendar to aid date selection
dateRangeInput A pair of calendars for selecting a date range
fileInput A file upload control wizard
helpText Help text that can be added to an input form
numericInput A field to enter numbers
radioButtons A set of radio buttons
selectInput A box with choices to select from
sliderInput A slider bar
submitButton A submit button
textInput A field to enter text
 1
 2
 3
 4
 5
 6
 7
 8
 9
10
11
12
13
14
15
16
17
18
19
20
21
22
23
24
25
26
27
28
29
30
31
32
33
34
35
36
37
38
39
40
41
42
43
44
45
46
47
48
49
50
51
52
53
54
55
56
57
58
59
60
61
62
63
64
65
66
67
68
69
70
71
72
73
74
75
76
77
78
79
80
81
82
83
84
85
86
library(shiny)

# Define UI ----
ui <- fluidPage(
  titlePanel("Basic widgets"),

  fluidRow(

    column(3,
           h3("Buttons"),
           actionButton("action", "Action"),
           br(),
           br(),
           submitButton("Submit")),

    column(3,
           h3("Single checkbox"),
           checkboxInput("checkbox", "Choice A", value = TRUE)),

    column(3,
           checkboxGroupInput("checkGroup",
                              h3("Checkbox group"),
                              choices = list("Choice 1" = 1,
                                             "Choice 2" = 2,
                                             "Choice 3" = 3),
                              selected = 1)),

    column(3,
           dateInput("date",
                     h3("Date input"),
                     value = "2014-01-01"))
  ),

  fluidRow(

    column(3,
           dateRangeInput("dates", h3("Date range"))),

    column(3,
           fileInput("file", h3("File input"))),

    column(3,
           h3("Help text"),
           helpText("Note: help text isn't a true widget,",
                    "but it provides an easy way to add text to",
                    "accompany other widgets.")),

    column(3,
           numericInput("num",
                        h3("Numeric input"),
                        value = 1))
  ),

  fluidRow(

    column(3,
           radioButtons("radio", h3("Radio buttons"),
                        choices = list("Choice 1" = 1, "Choice 2" = 2,
                                       "Choice 3" = 3),selected = 1)),

    column(3,
           selectInput("select", h3("Select box"),
                       choices = list("Choice 1" = 1, "Choice 2" = 2,
                                      "Choice 3" = 3), selected = 1)),

    column(3,
           sliderInput("slider1", h3("Sliders"),
                       min = 0, max = 100, value = 50),
           sliderInput("slider2", "",
                       min = 0, max = 100, value = c(25, 75))
    ),

    column(3,
           textInput("text", h3("Text input"),
                     value = "Enter text..."))
  )

)

# Define server logic ----
server <- function(input, output) {

}

# Run the app ----
shinyApp(ui = ui, server = server)

server

Shiny provides a family of functions that turn R objects into output for your user interface. Each function creates a specific type of output.

Output function Creates
dataTableOutput DataTable
htmlOutput raw HTML
imageOutput image
plotOutput plot
tableOutput table
textOutput text
uiOutput raw HTML
verbatimTextOutput text
render function creates
renderDataTable DataTable
renderImage images (saved as a link to a source file)
renderPlot plots
renderPrint any printed output
renderTable data frame, matrix, other table like structures
renderText character strings
renderUI a Shiny tag object or HTML

一个实际的例子

/post/RShiny-demo.gif

/home/william/Documents/blog/content/post/RShiny-demo.gif

设计框架

RShiny 包含两部分内容,一个是前端的 UI 界面部分,另一个是后端的 Server 服务。

前端 UI

我们首先需要定义前端,即需要先规划好想要表达的内容与方式。

 1
 2
 3
 4
 5
 6
 7
 8
 9
10
11
12
13
14
15
16
17
18
19
20
21
22
23
24
25
26
27
28
29
30
31
32
33
34
35
36
37
38
39
40
41
42
43
## ------------------------------------------------------------------------------------
## ui = header + sidebar + body
## icon: https://fontawesome.com/icons?d=gallery&p=1
header <- dashboardHeader(title = "RShiny @william")
sidebar <- dashboardSidebar(
    sidebarMenu(
        menuItem("CFFEX", tabName = "CFFEX", icon = icon("warehouse")),
        menuItem("CFFEX_T", tabName = "CFFEX_T", icon = icon("ticket-alt")),
        menuItem("SHFE", tabName = "SHFE", icon = icon("city")),
        menuItem("DCE", tabName = "DCE", icon = icon("shopping-basket")),
        menuItem("STOCKS", tabName = "STOCKS", icon = icon("coins")),
        menuItem("ConvBond", tabName = "CV", icon = icon("comment-dollar"))
    )
)

tab_main <- function(exch) {
	## some R code goes here
}

tab_product <- function(exch) {
	## some R code goes here
}

body <- dashboardBody(
    tabItems(
        ## CFFEX ---------------------------------------------- begin
        tabItem(tabName = "CFFEX",
                navbarPage("",
                           id = "CFFEX_nav",
                           theme = shinytheme("flatly"),
                           tab_main("CFFEX"),
                           tab_product("CFFEX"),
                           tab_data("CFFEX"),
                           tab_sig("CFFEX")
                )
        ),
        ## CFFEX ---------------------------------------------- end
    )
)

## gear up all
dashboardPage(header, sidebar, body)
ui = dashboardPage(header, sidebar, body)

后端 Server

server 其实是一个很大的函数,包含了三个具体的参数,这个函数有点类似 callback,允许我们在里面定义自己的操作,然后把这个函数传递给 shiny 进行具体的解析。

1
2
3
server = function(input, output, session) {
	## some R code goes here
}

其中,

  • input 是我们可以从 UI 界面交互获取的内容,比如 input$CFFEX_main_select_session,通过这个变量我们就可以实时的从界面获取用户想要我们执行的参数

  • output 是我们想要 server 计算的结果返回给 UI。比如,我们在上面的 UI 定义了一个 tab_main 的组件,代码里面包含了这么一个命令

    1
    
    plotlyOutput(sprintf("%s_sig", exch), width = "100%", height = "620px")

    UI 期望可以通过 Server 获取到这个返回,那么我们的 output 就可以写成这样

    1
    2
    3
    
    output$CFFEX_T_main <- renderPlotly({
      ## some R code goes here
    })
  • 细心的你,还发现我添加了一些按钮,你只需要轻松的点击按钮或者选择框,就可以得到想要的结果。这个用编程语言讲,叫做事件触发。我们通过添加观察组,针对不同的事件执行相应的策略。比如,观察到用户选择不同的信号名称,那么我们就更新相应的图片:

     1
     2
     3
     4
     5
     6
     7
     8
     9
    10
    11
    12
    13
    14
    15
    16
    
    observe({
      if (input$CFFEX_sig_reset == 0)
      {
          updateCheckboxGroupInput(session, inputId="CFFEX_sig_select_signame", label = NULL,
                                   choices = all.cffex.sig.names,
                                   selected = grep("pred", all.cffex.sig.names, value = T),
                                   inline = TRUE)
      }
      else
      {
          updateCheckboxGroupInput(session, inputId="CFFEX_sig_select_signame", label = NULL,
                                   choices = all.cffex.sig.names,
                                   selected = grep("pred", all.cffex.sig.names, value = T),
                                   inline = TRUE)
      }
    })

完工

最后,我们把 UIServer 交给 shiny去解析并生成相应的网页信息即可

1
2
## ------------------------------------------------------------------------------------
shinyApp(ui, server)

Docker 安装 Rshiny

1
2
3
4
5
6
7
8
9
docker run --name rshiny -dit --privileged=true -p 58787:8787 -p 53838:3838 wuya-centos7-r4.0:v1.0 /sbin/init

## 添加用户,需要进入 docker 添加用户
docker exec -it rshiny bash
sudo adduser tester
sudo passwd tester

## 安装 R
https://www.osradar.com/how-to-install-r-and-rstudio-on-centos-8/

相关内容

william 支付宝支付宝
william 微信微信
0%